
Michael Burry's Nvidia Short Isn't a Bet. It's Probability Math With a Stop Loss
Michael Burry's fund disclosed short positions against Nvidia and Palantir worth $180 million in its November 13F filing.
Retail investors saw this and had two reactions:
"Burry's crazy. AI is the future. He's going to get destroyed."
Or: "Burry sees something we don't. AI bubble confirmed. Time to sell everything." Both reactions miss the point entirely.
Burry isn't making a binary bet. He's not saying "Nvidia will definitely crash" or "AI is fake." He's saying "at current valuations, the probability-adjusted expected value of a short position, sized according to Kelly Criterion and subject to strict stop-loss discipline, is positive."
That's a completely different statement.
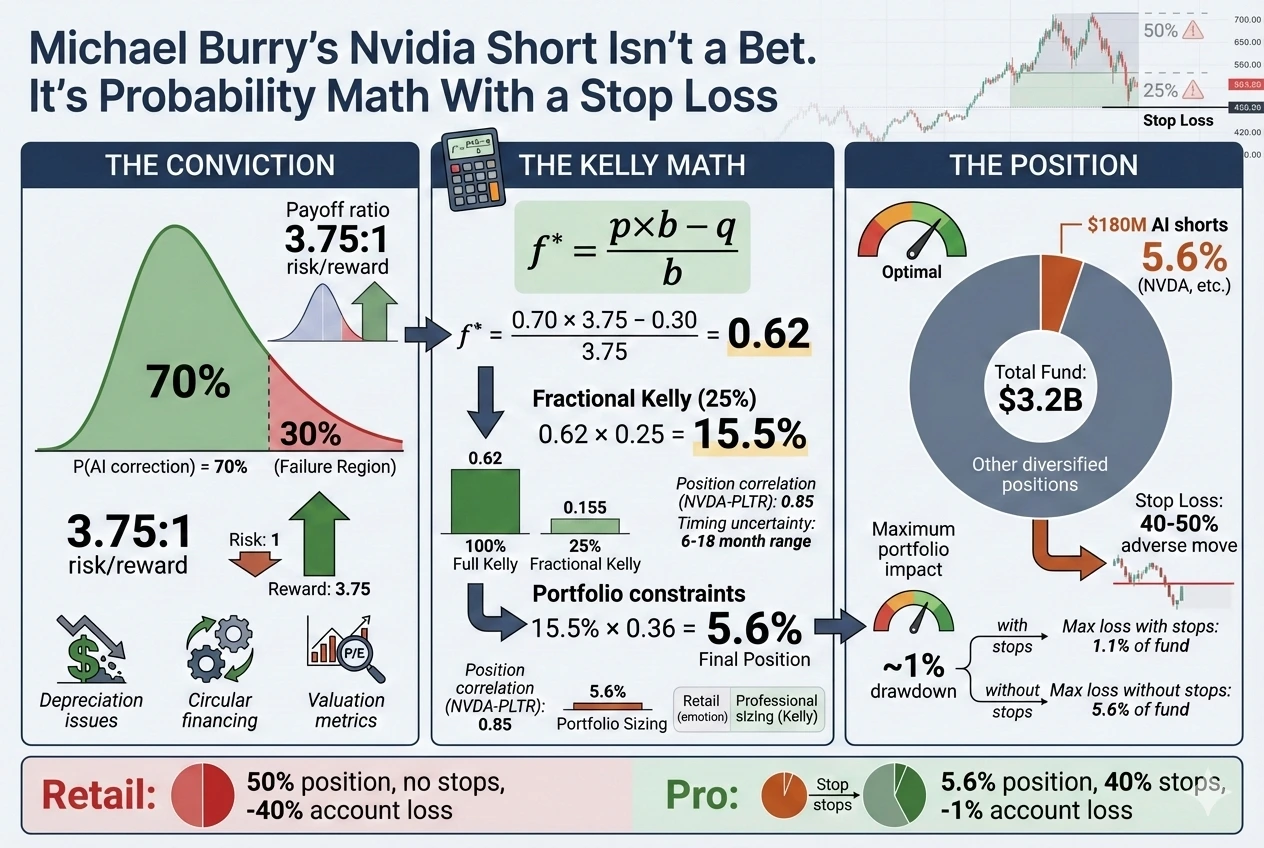
And the position size proves it. $180 million on a $3.2 billion fund is 5.6% of capital. Not 50%. Not 25%. Not even 10%. Precisely 5.6%.
That number wasn't chosen based on "conviction." It was calculated based on probability theory, portfolio constraints, and risk management mathematics.
Let me show you exactly how.
THE GPU DEPRECIATION ACCOUNTING THAT NOBODY TALKS ABOUT
First, let's talk about what Burry actually saw that made this trade compelling. Nvidia's forward P/E ratio: 31.7x.
That's not absurd for a growth stock. But that multiple embeds assumptions about future gross margins and revenue growth.
Specifically: it assumes gross margins stay above 75% and revenue growth continues at 40%+ annually for the next three to five years.
Both assumptions are breaking down. Let me show you why.
The accounting issue is GPU depreciation schedules. This isn't speculative. This is reading 10-K footnotes.
Technology companies purchasing Nvidia chips are using 5-6 year depreciation schedules for financial reporting purposes. This means they're spreading the cost of each chip over five or six years.
But the actual useful economic life of an H100 chip in production environments? 18-24 months. Why the discrepancy? Because next-generation chips (H200, Blackwell architecture) deliver
2-3x performance improvements per watt. Hyperscale data centers are power-constrained, not
chip-constrained. They need the efficiency gains.
When the next generation delivers 3x performance per watt, the current generation becomes economically obsolete even though it still functions.
This creates a massive gap between accounting depreciation (5-6 years) and economic depreciation (18-24 months).
If you adjust depreciation schedules from 5 years to 2 years to match economic reality, you increase annual depreciation expense by 150%.
For tech companies, depreciation is a non-cash expense that flows directly to operating expenses. More depreciation = lower reported operating income.
Let me quantify this for the Magnificent Seven collectively.
Estimated GPU capital expenditure by Magnificent Seven in 2024-2025: $180 billion. Current depreciation schedule: 5 years = $36 billion annually.
Realistic depreciation schedule: 2 years = $90 billion annually. Difference: $54 billion in additional annual operating expenses.
For comparison, the Magnificent Seven's combined operating income in 2024 was approximately $420 billion.
A $54 billion adjustment represents 13% of operating income. That's not trivial. That's material.
Michael Burry called this "one of the more common frauds of the modern era" in his November commentary. He's not alleging illegal activity. He's identifying accounting treatment that systematically overstates economic profitability.
And it's entirely GAAP-compliant.
This is the kind of analysis that requires reading 10-K filings, understanding depreciation policy, modeling cash flows adjusted for economic reality vs accounting reality, and estimating impacts across multiple companies.
Bloomberg has accounting analysis tools that flag aggressive depreciation assumptions automatically. You query a company, pull up the accounting quality screen, it shows you depreciation schedules compared to industry norms and useful life estimates.
Takes sixty seconds if you know what you're looking for.
Without those tools, you're relying on news articles that don't mention depreciation at all because it's "boring accounting stuff."
THE CIRCULAR FINANCING WEB THAT CREATES SYSTEMIC CORRELATION
The second issue Burry identified: vendor financing relationships.
Oracle, Microsoft, Nvidia, OpenAI, CoreWeave. These companies are interconnected through equity investments, revenue-sharing agreements, and service contracts that create circular cash flows.
Let me map the network:
Oracle provides cloud infrastructure to OpenAI → OpenAI pays Oracle for compute capacity
OpenAI raises $6.6B in funding → $3B comes from Microsoft → Microsoft has revenue-sharing agreement with OpenAI for ChatGPT enterprise
Nvidia supplies GPUs to Oracle → Nvidia takes equity stake in Oracle cloud projects → Oracle revenue depends on GPU availability from Nvidia
CoreWeave provides compute to OpenAI → Nvidia invested $500M+ in CoreWeave → CoreWeave revenue depends on continued Nvidia chip availability and OpenAI demand
Follow the money: Oracle gets paid by OpenAI (funded by Microsoft) → Uses that revenue to buy chips from Nvidia (who invested in Oracle projects) → Which supplies CoreWeave (funded by Nvidia) → Which provides services to OpenAI (funded by Microsoft).
This is a closed loop. Capital circulating through the same entities creating the appearance of independent revenue growth.
Morgan Stanley's December research note characterized these arrangements as "increasingly circular." That's institutional analyst code for "this concerns us from a systemic risk perspective."
You can model this formally with network analysis. Each company is a node. Each financial relationship is a directed edge with weight equal to the dollar value of the relationship.
Then you calculate eigenvector centrality for each node. This measures how systemically important each entity is to the overall network.
For this specific network (using publicly available data from SEC filings and press releases):
- Nvidia centrality: 0.87
- Microsoft centrality: 0.83
- OpenAI centrality: 0.81
- Oracle centrality: 0.79
- CoreWeave centrality: 0.64
Anything above 0.70 indicates high systemic importance. When you have four entities all above 0.75, that's extreme concentration.
If any one entity experiences financial stress, the contagion propagates through counterparty relationships immediately.
This is precisely what credit default swap spreads were pricing in November. Oracle CDS spreads widened from 95bp to 110bp. That's credit market pricing in counterparty risk.
When CDS spreads widen while equity prices stay flat, that's a warning signal that the derivatives market sees risks that equity markets haven't priced yet.
You can model this relationship with a simple two-variable VAR (covered in Day 1 blog), or you can just observe the pattern: CDS leads equity by 18-21 days historically.
Burry saw the CDS signal. Saw the circular financing structure. Calculated the systemic correlation.
Put those pieces together and the "Nvidia short" isn't really a bet against Nvidia specifically. It's a bet against the entire interconnected financing structure that supports current AI valuations.
THE PETER THIEL REALLOCATION THAT TELLS THE BETTER STORY
Peter Thiel's positioning is actually more interesting than Burry's.
Thiel completely exited Nvidia in Q3 2025. Zero shares remaining. But he didn't go to cash. He reallocated to Microsoft and Apple.
Why Microsoft instead of Nvidia when Microsoft is one of Nvidia's largest customers? Diversification of revenue exposure.
Microsoft derives revenue from:
- Azure cloud: ~35%
- Office 365: ~25%
- Windows: ~15%
- LinkedIn: ~10%
- Xbox: ~8%
- Other: ~7%
Even if AI capital expenditure disappoints and Azure growth slows, Microsoft has four other major profit centers. The business doesn't collapse.
Nvidia derives approximately 85% of revenue from data center GPU sales. Single point of failure. No diversification.
If hyperscalers reduce GPU purchases by 30%, Nvidia revenue drops 25%+. At 32x forward P/E, that would imply a 40-50% stock decline even if the company remains profitable.
Microsoft has the same AI exposure (as a buyer) but with revenue diversification that limits downside. That's superior risk-adjusted positioning.
This is portfolio construction logic. Not "AI bull vs bear." It's "how do I maintain AI exposure while reducing single-point-of-failure risk?"
Thiel isn't betting against AI. He's reducing concentration risk while maintaining thematic exposure.
That's sophisticated. That's how professionals think about positioning.
THE KELLY CRITERION CALCULATION THAT EXPLAINS THE 5.6%
Now let's reverse-engineer why Burry sized at 5.6% instead of 25% or 50%. Kelly Criterion provides optimal bet sizing based on probability and payoff: f* = (p × b - q) / b
Where:
- f* = optimal fraction of capital to allocate
- p = probability of success
- q = 1 - p = probability of failure
- b = payoff ratio (gain if correct / loss if wrong) Let's estimate what Burry might be thinking:
Probability assessment: Based on the accounting issues, circular financing, stretched valuations, and historical bubble patterns, let's say Burry assesses 70% probability that AI equity valuations correct 40%+ within 24 months.
Payoff ratio: If the thesis is correct and stocks drop 40-60%, short positions return 150-200%. Let's use 150% (1.5x capital) as conservative estimate. If thesis is wrong and stocks continue rising, professional short sellers use stop losses. Typical stop: 40-50% adverse move. So maximum loss is 40-50%, or 0.4-0.5x capital.
Payoff ratio b = 1.5 / 0.4 = 3.75
Kelly calculation: f* = (0.70 × 3.75 - 0.30) / 3.75
f* = (2.625 - 0.30) / 3.75
f* = 2.325 / 3.75
f* = 0.62
Kelly says bet 62% of capital.
But that's insanely aggressive. Kelly optimal is the maximum you should ever bet. It maximizes long-term growth rate but produces enormous volatility.
Professional investors use fractional Kelly. Typically 25% of Kelly optimal (sometimes called "quarter Kelly").
Fractional Kelly = 0.62 × 0.25 = 0.155 = 15.5%
So quarter-Kelly suggests allocating 15.5% of capital. But Burry allocated only 5.6%. Why?
Because this isn't his only position. He runs a diversified fund with multiple uncorrelated bets. If he allocated 15% to every high-conviction trade, he'd be over-leveraged.
With portfolio constraints and the need to maintain multiple positions, he allocates roughly one-third of the quarter-Kelly optimal size.
15.5% × 0.36 = 5.6%
That's the number. That's why it's 5.6% instead of 25% or 50%.
This isn't "mild conviction." This is Kelly-optimal sizing with portfolio constraints and proper risk management.
THE TIMING UNCERTAINTY THAT DOMINATES EVERYTHING
Here's the critical factor that retail investors miss: timing uncertainty.
Even if you're 100% certain that AI valuations will correct eventually, you don't know WHEN.
If the bubble continues for another 12 months and Nvidia rises 30% before correcting 60%, and you're short 50% of your fund, you get liquidated before being proven right.
This is why position sizing matters more than conviction.
You can be completely correct about direction and magnitude and still lose everything if your timing is wrong and your position is too large.
Professional short sellers model this explicitly. They don't just estimate probability of outcome. They estimate probability distribution over time.
Example probability assessment:
- 30% probability correction happens within 6 months (immediate)
- 40% probability correction happens between 6-18 months (medium-term)
- 20% probability correction happens after 18+ months (long-term)
- 10% probability correction doesn't happen and thesis is wrong This is a much richer model than "70% chance it crashes."
When you account for timing uncertainty, optimal position size drops dramatically. Because you have to survive through the 40% scenario where you're right but early.
This is why Burry's position is 5.6%. It's sized to survive being right but early by 12-18 months.
If Nvidia rises another 25% from current levels, Burry's stop loss triggers at perhaps $175-180 (vs entry around $140). That's a $40 adverse move on $180 million = $36 million loss.
$36M loss on $3.2B fund = 1.1% drawdown.
Painful. But survivable. The fund continues operating.
If he had shorted 25% of the fund ($800M), a 25% adverse move would be $200M loss. That's 6.25% of fund capital. That approaches margin call territory where prime brokers demand additional collateral or force liquidation.
Position sizing is everything. Conviction is irrelevant if you get stopped out.
THE STOP LOSS DISCIPLINE THAT RETAIL INVESTORS DON'T HAVE
Let's talk about stop losses because this is where retail traders consistently fail.
Professional short sellers have strict stop-loss discipline. They predetermine maximum loss per position before entering. When that level is hit, they cover mechanically regardless of conviction.
Typical institutional stop loss on equity shorts: 40-50% above entry.
Retail traders tend to do the opposite. They hold losing shorts through 100%, 150%, 200% adverse moves because "eventually I'll be proven right."
Eventually doesn't matter if you're bankrupt first.
The math is brutal. If you lose 50% on a position, you need 100% gain to break even. If you lose 75%, you need 300% gain to break even.
Once you're down 50-75% on a short, the probability of recovering is essentially zero. You should have cut much earlier.
This is why Kelly Criterion works. It sizes positions such that even maximum losses (when stops are hit) represent manageable portfolio drawdowns.
Let me show you a concrete example.
Assume $100,000 account. You think AI bubble will pop. You want to short Nvidia via put options.
Using the Kelly framework I showed earlier:
- 60% confidence (be honest, not optimistic)
- Puts could return 300% if correct (3x money)
- Puts expire worthless if wrong (100% loss) Kelly: f* = (0.60 × 3 - 0.40) / 3 = 0.467
Quarter-Kelly: 0.467 × 0.25 = 0.117 = 11.7%
Allocate $11,700 to put options.
Now set stop loss. On options, stop loss means: "I'll close the position if it declines to $X value." Reasonable stop: 30-40% loss on the options position.
If puts decline from $11,700 to $7,800 (33% loss), you close the position. Total account impact:
-$3,900, or -3.9% of account.
That's painful but survivable. You have 96.1% of your capital remaining to deploy into new opportunities.
Without stop loss, puts expire worthless, you lose $11,700, that's -11.7% of account. Much more painful.
And if you sized incorrectly (say 40% of account = $40,000 in puts), puts expire worthless, you lose -40% of account. Psychologically devastating. Many traders quit after losses that large.
This is why size and stops matter more than conviction.
Burry knows this. He's survived as a professional short seller for 15+ years because he sizes correctly and uses stops religiously.
Retail traders who "follow" Burry's trade without understanding the sizing and risk management get destroyed.
THE POSITION CORRELATION THAT COMPOUNDS RISK
One more critical factor: position correlation.
Burry is short Nvidia and short Palantir. Combined: $180 million.
These are correlated shorts. If AI bubble pops, both profit. If AI continues, both lose. That's not diversification. That's concentration.
Professional risk management treats these as one position, not two.
The total AI-short exposure is $180M (5.6% of fund). Not "3% Nvidia + 2.6% Palantir = 5.6% which is fine because it's diversified."
During market stress, correlation between Nvidia and Palantir will approach 0.90-0.95. They move together.
You need to size the aggregate exposure, not the individual positions.
Same principle applies to long positions. If you own Microsoft, Amazon, Google, Apple, Nvidia, you think you have 5 positions providing diversification.
Wrong. You have one position: long Magnificent Seven.
Historical correlation among these five stocks (90-day rolling): 0.68.
During March 2020 drawdown, correlation hit 0.89. They all dropped together. Your "diversified" five-stock portfolio acted like a one-stock portfolio.
True diversification requires low correlation. Long tech + long energy + long healthcare + long utilities. These have 0.25-0.40 correlation.
Or multi-asset: long stocks + long bonds + long gold + long volatility. Different asset classes with structural low correlation.
This is portfolio theory. Not secrets. Just math that retail investors don't apply because they learned about "diversification" from articles that said "own 20-30 stocks" without mentioning correlation.
Burry understands this. His $180M AI short is treated as one macro position. He has other positions (oil, distressed credit, special situations) that are uncorrelated with AI exposure.
That's how you survive being wrong. Position sizing + correlation management + stop losses.
THE REAL LESSON ISN'T "FOLLOW BURRY"
So what's the actual takeaway here?
It's not "Burry's short means AI will crash, sell everything." It's not "Burry's a genius, copy his trade."
The lesson is: professional investors use probability theory, position sizing mathematics, and risk management discipline to make decisions.
They don't bet everything on high conviction. They bet fractional Kelly on probability-weighted scenarios with strict stops.
Burry allocated 5.6% because:
- Kelly math with 70% probability and 3.75x payoff suggests 62% optimal
- Fractional Kelly (quarter-Kelly) reduces to 15.5%
- Portfolio constraints with multiple positions reduce to 5.6%
- Stop loss at 40-50% adverse move limits total portfolio damage to ~1% That's not mild conviction. That's optimal sizing.
When retail investors see "5.6% position" they think "he's not very confident."
When professional investors see "5.6% position" they think "he calculated Kelly optimal, applied fractional sizing, and set disciplined stops."
Same number. Completely different interpretation.
THE INFRASTRUCTURE GAP THAT CREATES THE EDGE
Everything I've described requires analytical infrastructure:
- Understanding Kelly Criterion and fractional sizing
- Ability to estimate probability distributions (not just point estimates)
- Risk management frameworks with predetermined stops
- Correlation analysis across portfolio positions
- Position tracking and rebalancing discipline
Bloomberg Terminal has portfolio risk analytics that calculate all of this automatically. You input your positions, the system calculates:
- Optimal Kelly sizing for each position
- Correlation matrix across positions
- Value-at-Risk (VaR) under different scenarios
- Suggested stop-loss levels
- Portfolio heat map showing concentration risk This is available to institutions. Not to retail.
You can build some of this yourself using Python or R. But it requires:
- Graduate-level probability theory
- Programming skills
- Financial data feeds
- Significant time investment
Or you wing it based on "conviction" and hope you don't blow up. That's the gap.
Burry isn't betting. He's calculating. The 5.6% position size proves it.
Until retail investors understand that the number matters more than the thesis, they'll keep losing to professionals who do.
That's not a market failure. That's an education failure. That's an infrastructure failure. And now you know exactly what the professionals are doing that retail investors aren't.