
Causal architecture
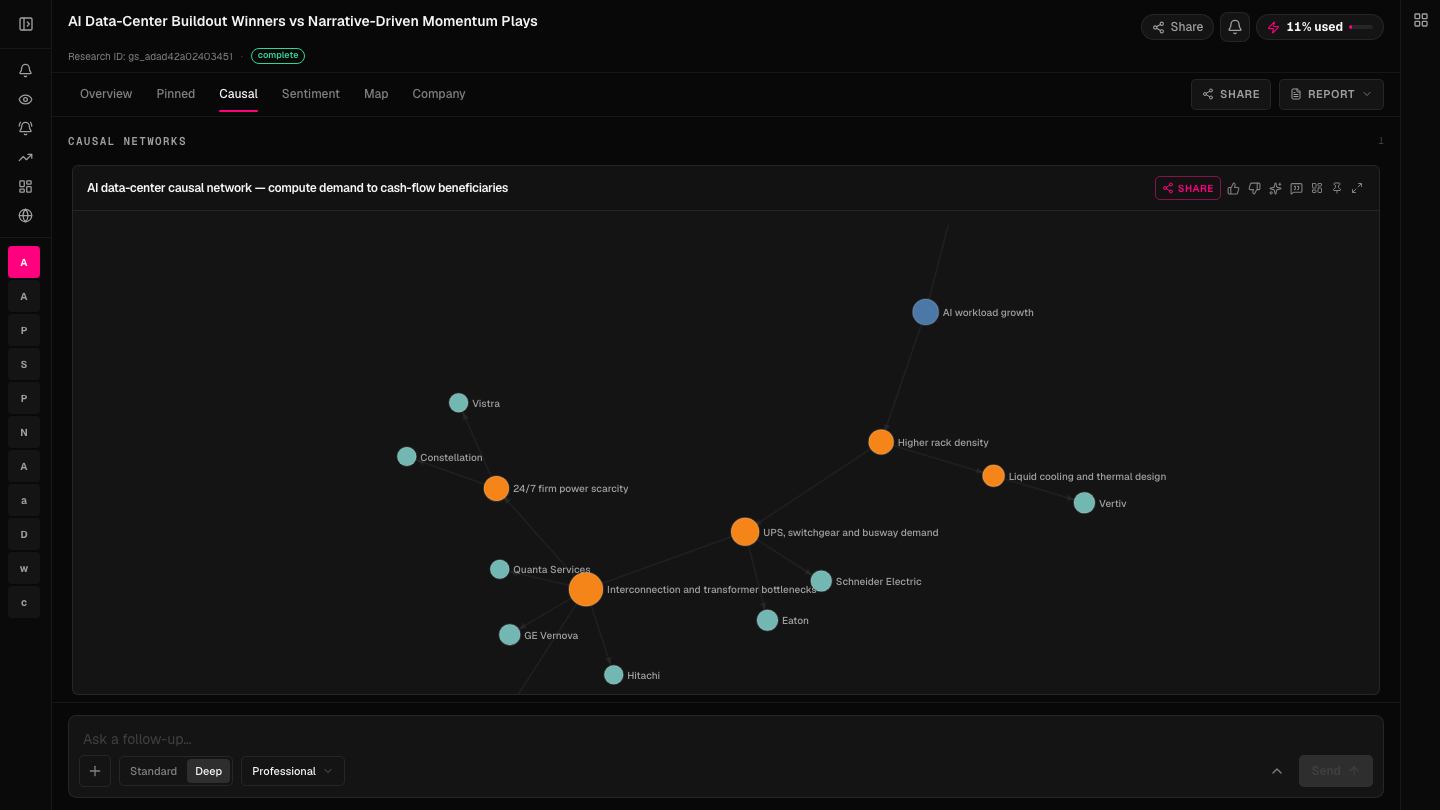
Directional graphs, not correlation heatmaps. Every answer surfaces the chain behind a market move — causality and correlation as distinct outputs.
Ask any question about any market. Plutonal tests the thesis across causal, statistical, and quantitative models — and shows the evidence behind the answer.
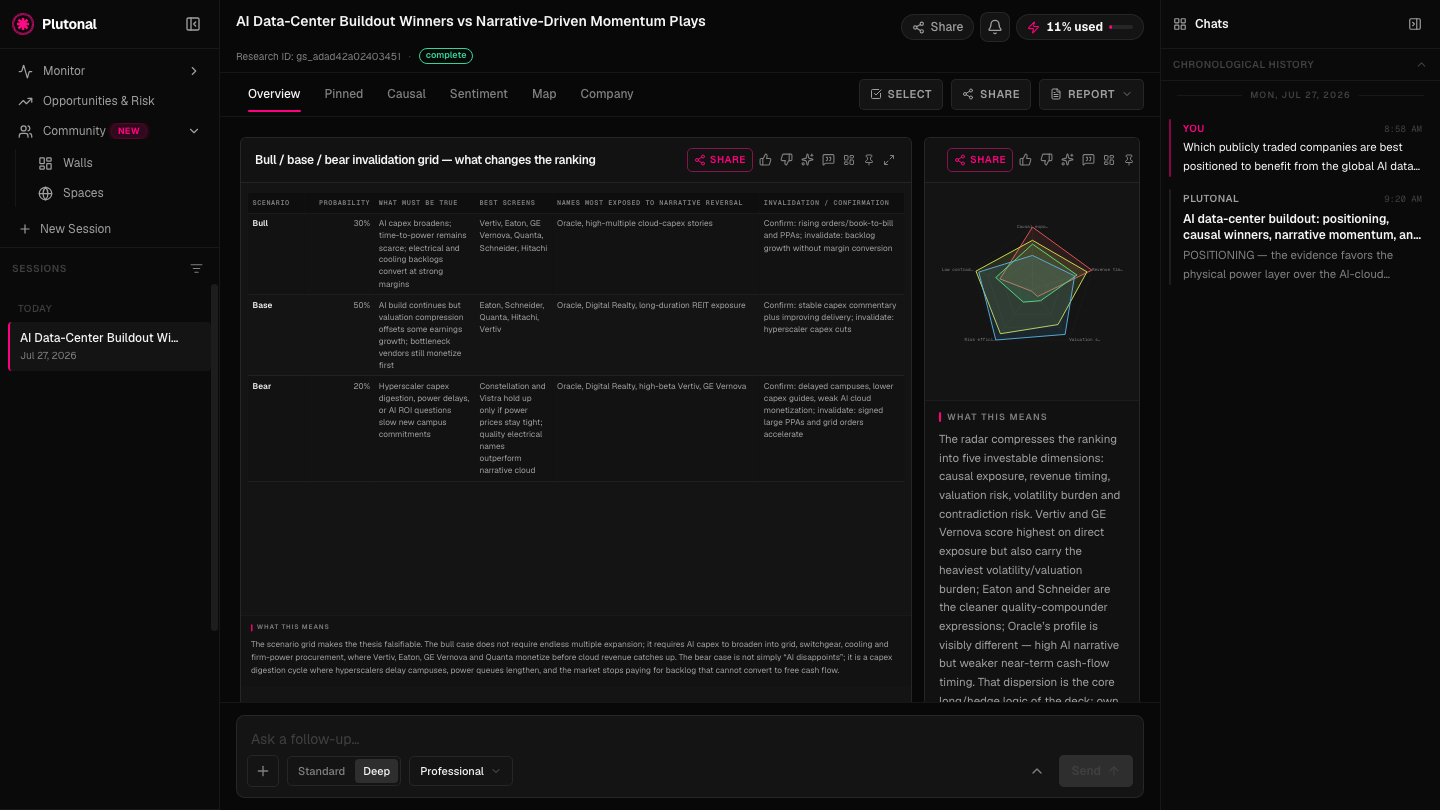
Plutonal accepts market research questions such as: Which publicly traded companies are best positioned to benefit from the global AI data-center buildout?
Compare bull, base, and bear cases, the conditions each requires, the companies most exposed, and the signals that would confirm or invalidate the result.
Follow an event through mechanisms and companies, with confidence at each link and weak points made explicit.
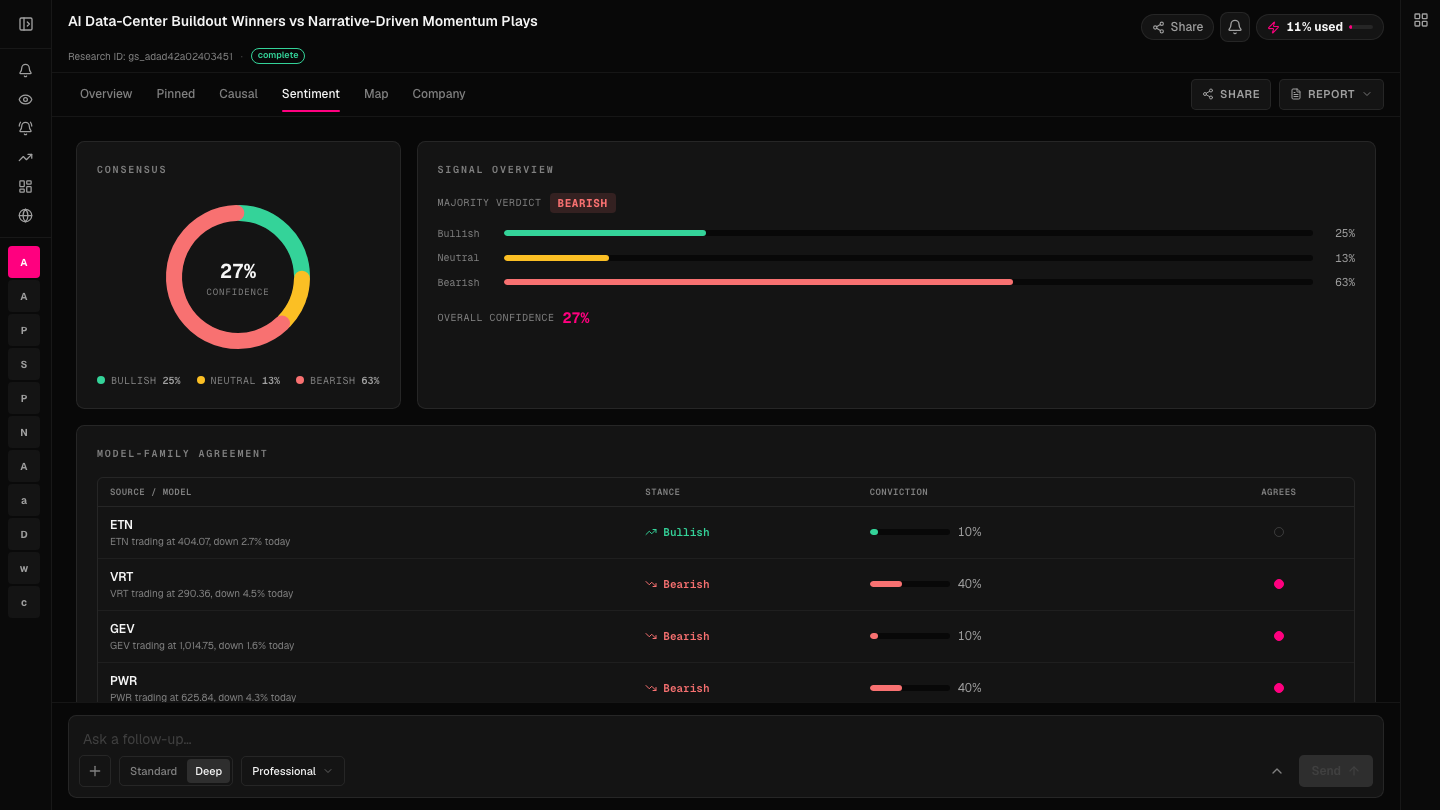
Read the verdict, confidence, and agreement across the model families behind the answer.
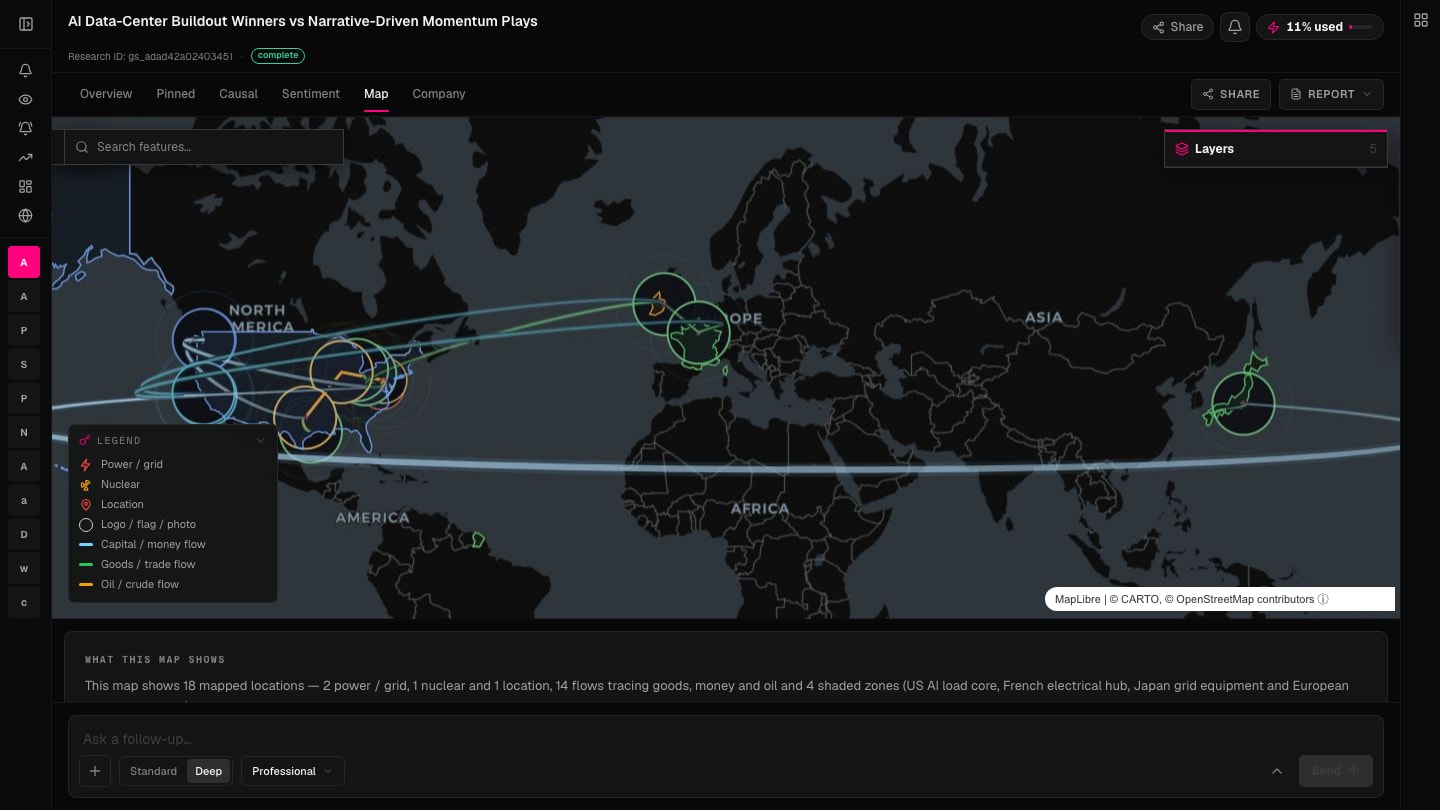
Place companies, infrastructure, and market exposure in geographic context, then follow the relationships between them.
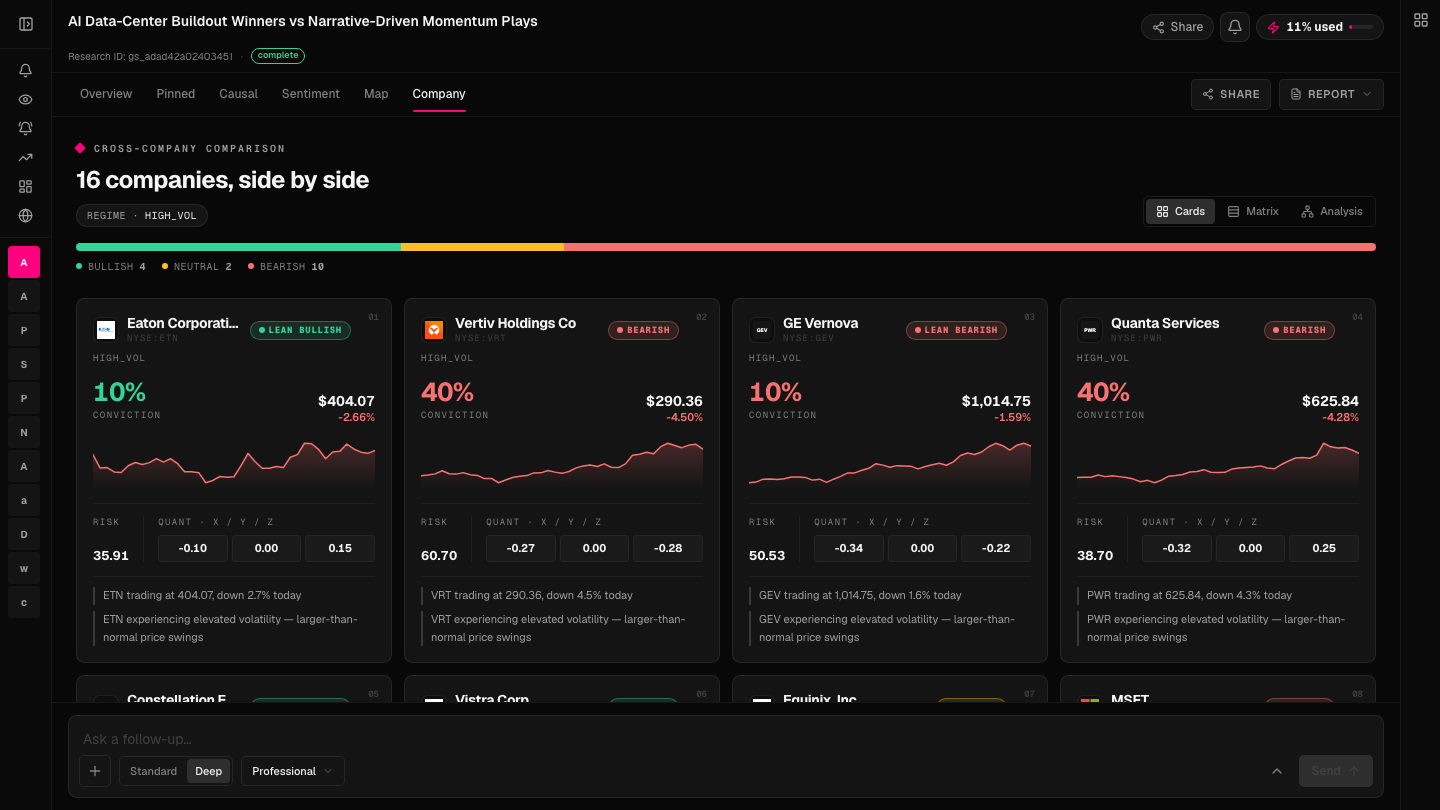
Compare conviction, price, regime, risk, and quantitative signals across the research universe.
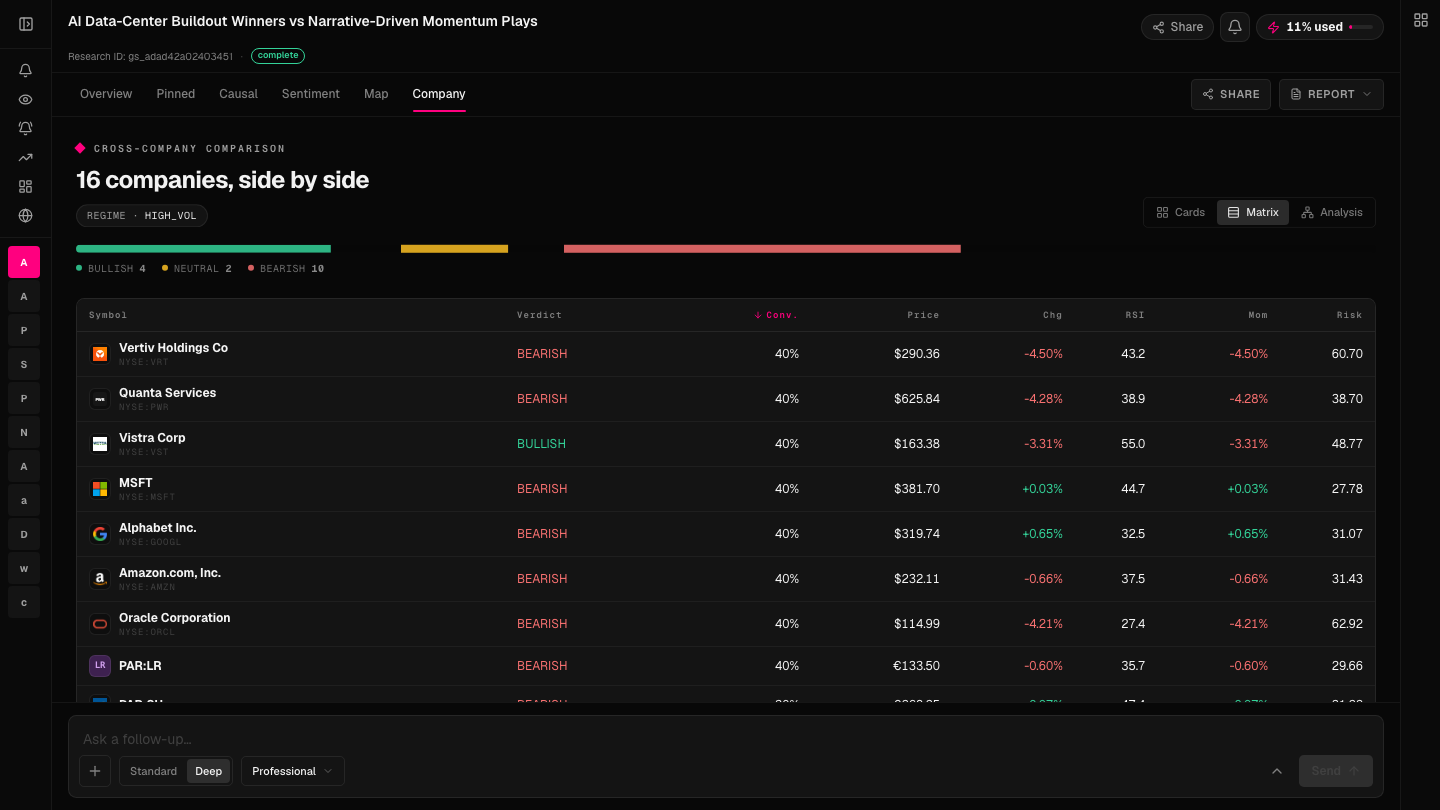
Sort the research universe by verdict, price action, momentum, and liquidity signals.
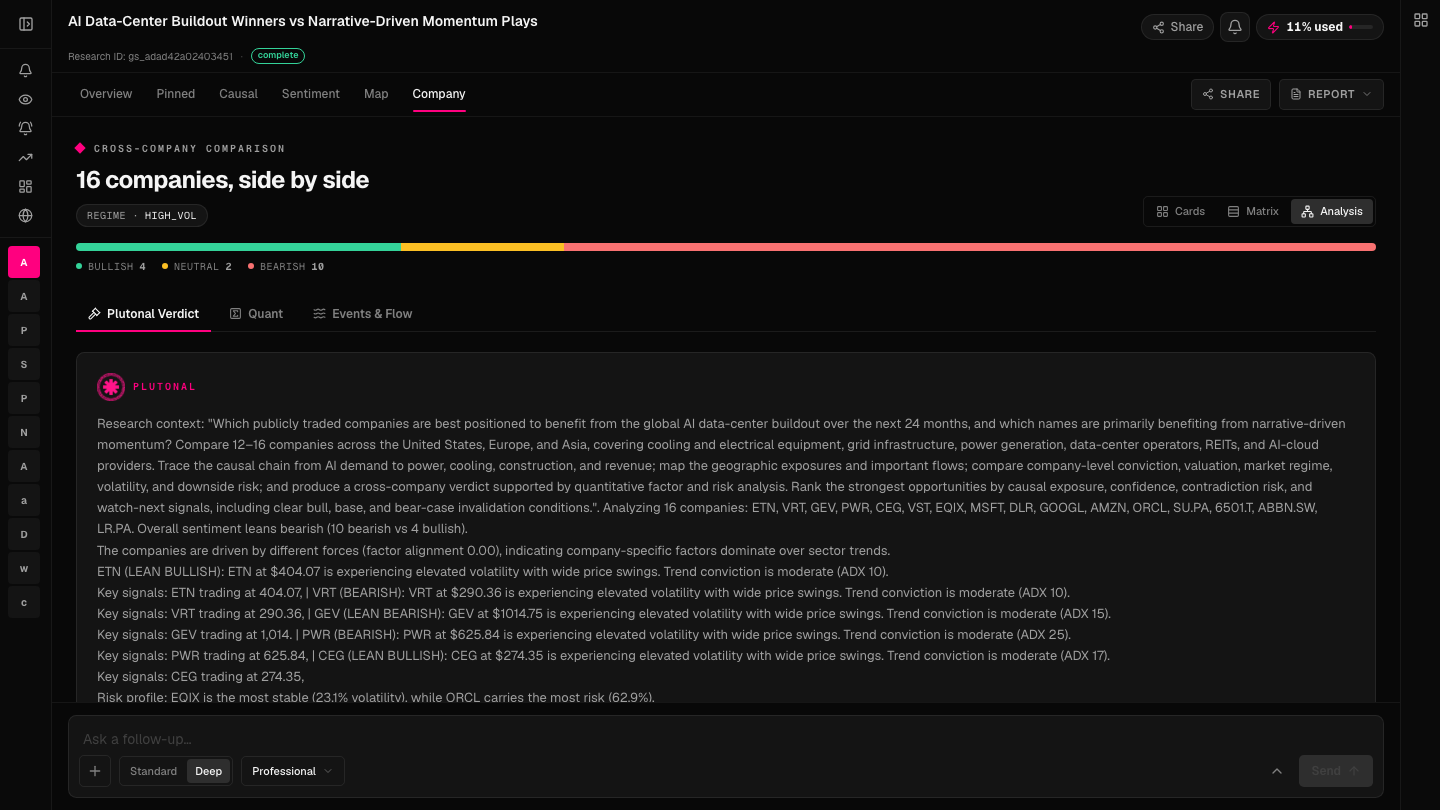
Read the cross-company conclusion, key findings, conviction levels, and highest-risk names in one analytical summary.
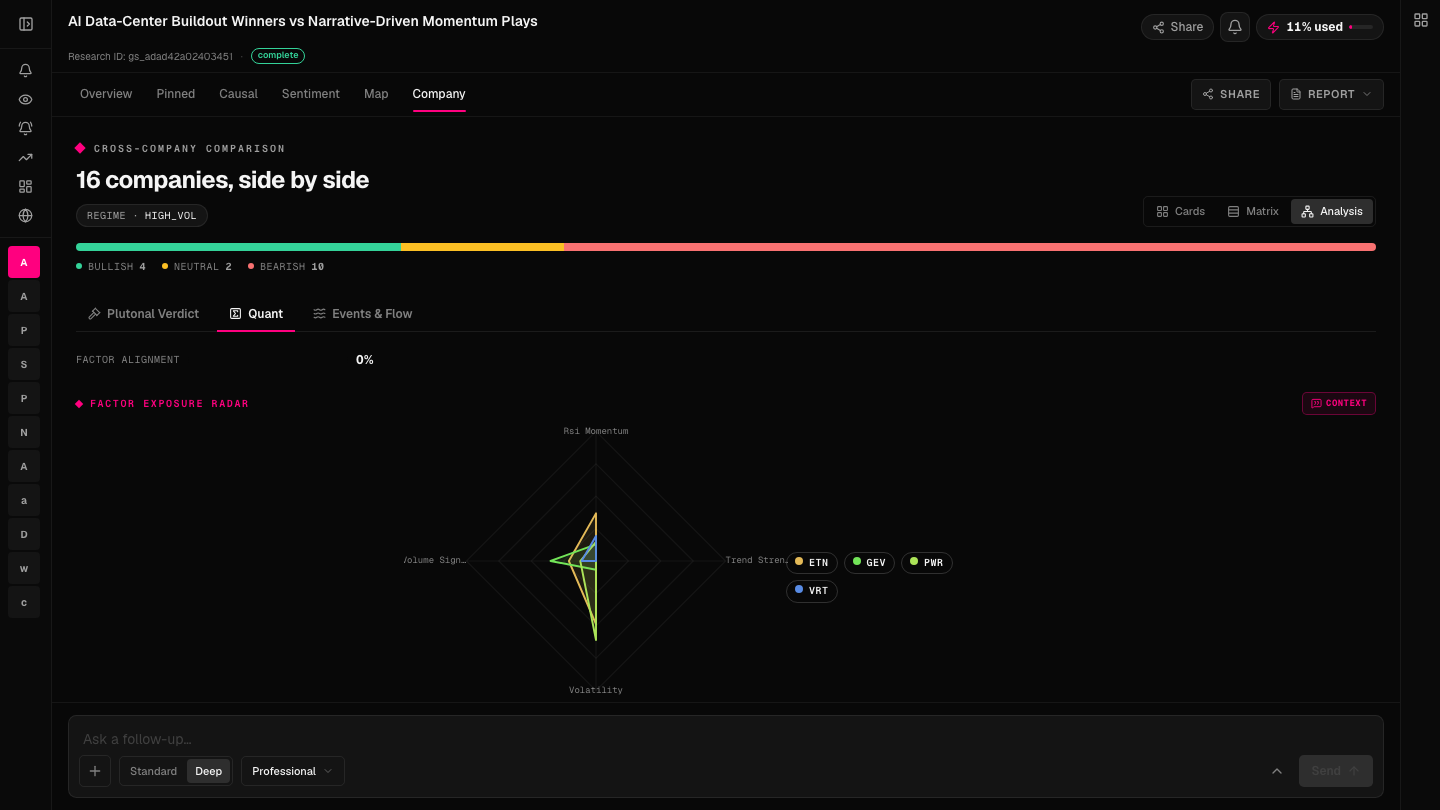
Compare RSI momentum, trend strength, volatility, and volume signals across the dynamically selected companies.
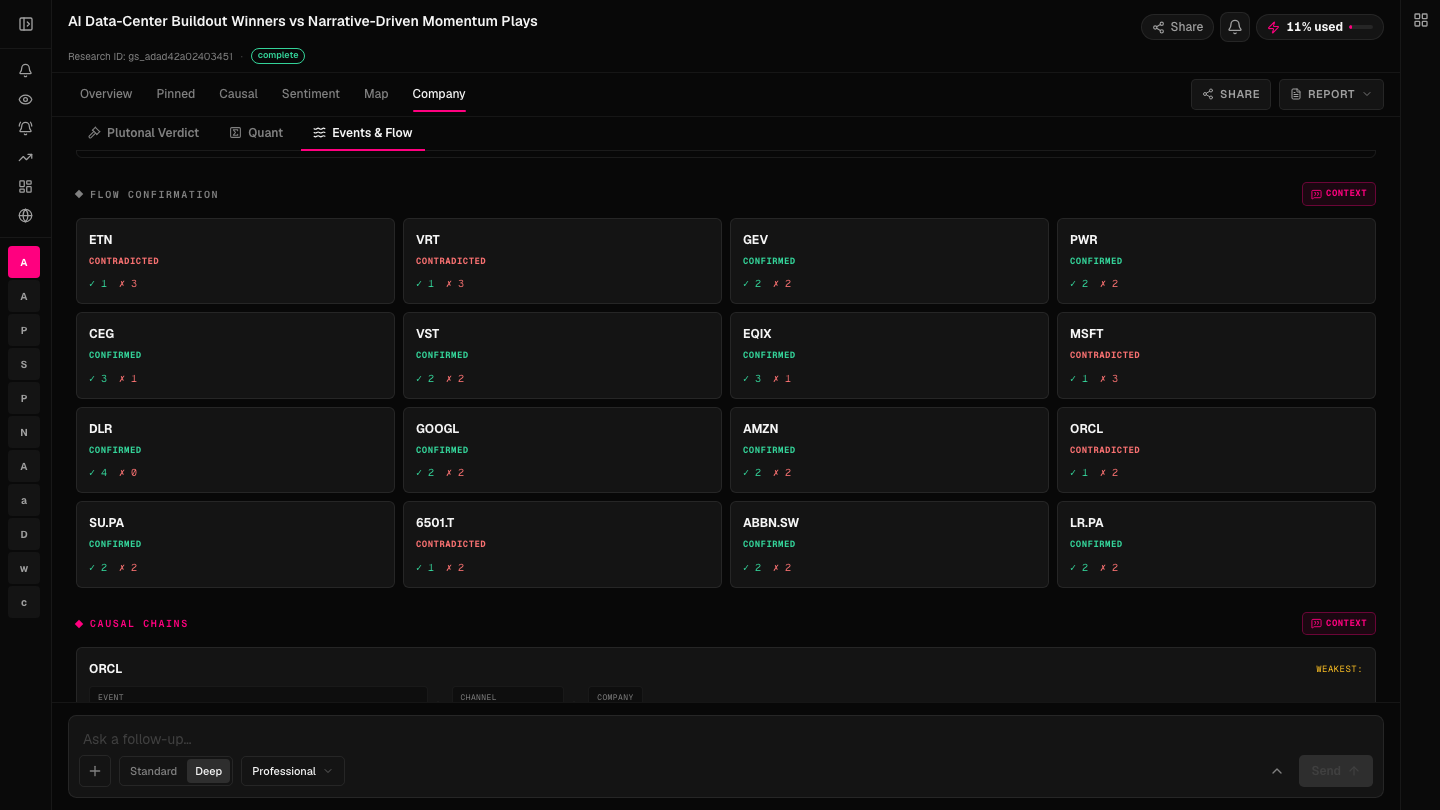
Review company-level confirmations and contradictions, then trace the supporting causal chain beneath them.
3,000+ equities across 40 global markets. 120+ data sources. Every number sourced, every series traceable.
Built for analysts working outside the institutional perimeter.
Scope can be a single ticker, a sector, a macro linkage, or a structural thesis. If you can write it as a question, Plutonal can answer it.
Granger causality, vector autoregression, GARCH, factor decomposition, regime-switching — selected by the question and validated against historical analogues.
Verdict, confidence interval, causal chain with dated lags, full evidence trail, and sourced data rows — exportable and traceable end-to-end.
The proprietary engine orchestrates six product surfaces. Each does one thing, rigorously.
Directional graphs, not correlation heatmaps. Every answer surfaces the chain behind a market move — causality and correlation as distinct outputs.
80+ models running simultaneously. Granger causality, VAR, GARCH, factor decomposition, regime-switching. Bias factors surfaced alongside every verdict.
Lens renders geographic and structural questions as annotated maps and ranked panels. Charts carry confidence cones, pattern marks, and regime overlays.
Sentiment rendered as a time series, not a single score. News, filings, and social signal from X (Twitter) — all event-annotated and dated.
Alerts fire on regime shifts and statistical thresholds — not on every price movement. Every trigger traces to one of 120+ verified data sources.
Every paid plan includes the complete research engine. Select access based on how extensively you expect to use it.
The orchestration layer is proprietary. The techniques themselves are standard. Naming them, with specification, is the point.
These are the techniques institutional quants use. Plutonal runs them on your questions. Each method answers a different question about market behaviour — whether one thing causes another, how several things move together, when the market’s rules have shifted, and why a specific thing moved.
Tests whether the past of one series improves the forecast of another beyond its own past. The difference between “these move together” and “this one moves first.”
A small system of equations in which every variable depends on every other variable’s recent history. Captures feedback, not just one-way effects.
Volatility as state-dependent and clustered in time rather than constant. The same price move is a different event in a calm regime than in a turbulent one.
A move is broken into exposures — sector, style, macro, idiosyncratic — so a name-specific signal can be separated from what the whole market is doing to every name.
Projections of future values rendered with credible intervals, not point estimates. When the model is uncertain, the uncertainty is visible. When the model is confident, the interval narrows.
Structured analysis of financial text — filings, transcripts, news, commentary — using the same techniques used inside institutional research. What’s being said, by whom, in what tone, and how that’s changed.
Sign in and put a real research question to the engine. Every answer comes back with the evidence and the confidence behind it.