
51% of All Stock Trades Happen Where You Can't See Them
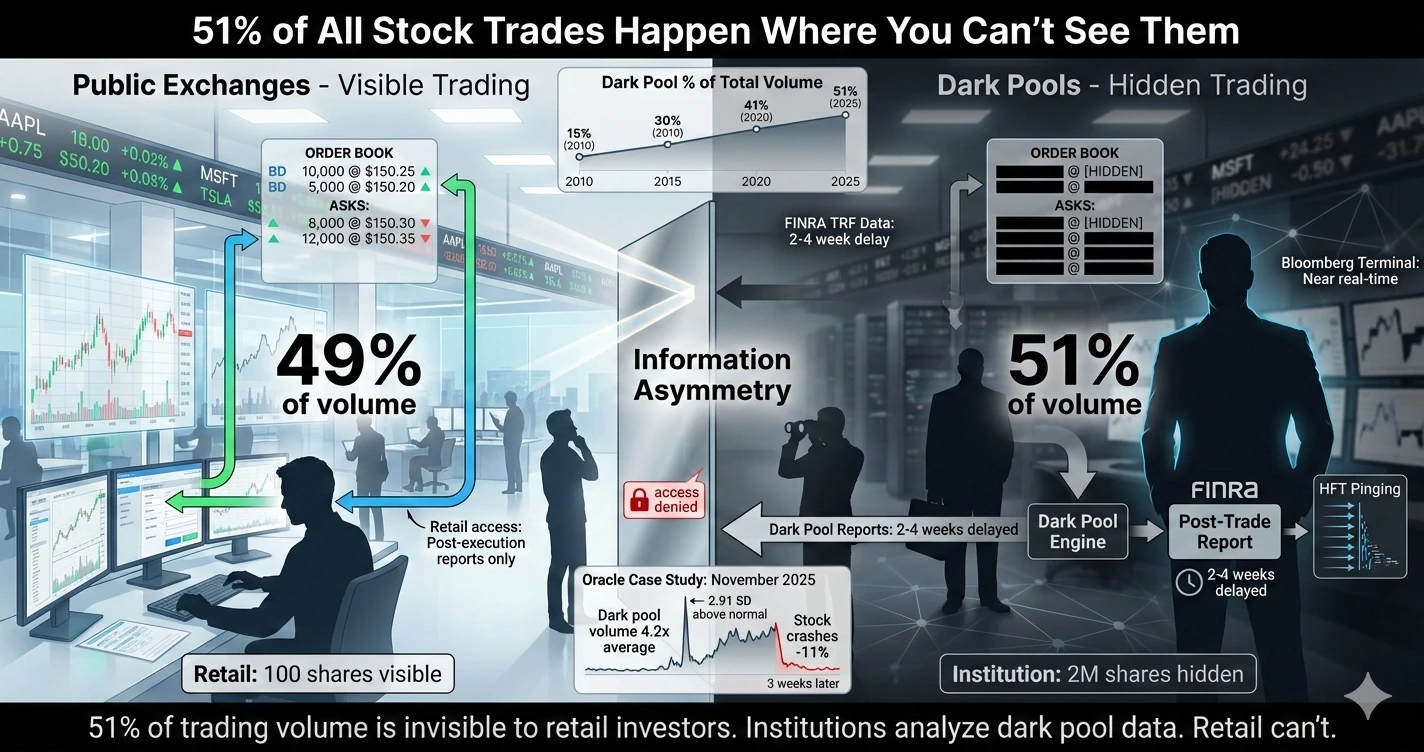
As of January 2025, 51% of all United States equity trading volume happens in dark pools.
Read that again. More than half of all trades occur in private venues with no pre-trade transparency. No visible order book. No indication that the trade is about to happen until after it's executed.
The term "dark pool" sounds conspiratorial. It's not. It's just a structural feature of modern markets that creates massive information asymmetry between institutions and retail investors.
Let me explain exactly how this works, why it matters, and what you can't see that institutions can.
HOW DARK POOLS ACTUALLY FUNCTION
When you place a market order to buy 100 shares of Apple through your retail broker, here's what happens:
Your order goes to your broker (Robinhood, Schwab, Fidelity, whatever). The broker has contractual relationships with market makers and dark pool operators. Before your order hits a public exchange like NYSE or Nasdaq, it passes through internal routing systems.
The broker can match your order against another customer's order inside their own dark pool. Or they can route it to a third-party dark pool operated by Goldman Sachs (Sigma X), Credit Suisse (Crossfinder), or JP Morgan (JPM-X).
If your 100-share buy order matches against someone's 100-share sell order in the dark pool, the trade executes privately. The price is typically the mid-point between the best bid and best ask on public exchanges at that moment.
This happens in milliseconds. You never know it occurred. You just see your order filled "at market."
Here's why this matters: institutional orders are sitting in those dark pools.
When a pension fund wants to sell 2 million shares of Microsoft, they don't blast that order onto NYSE where everyone can see it and front-run them. They send it to a dark pool operated by Goldman Sachs or another major bank.
Your 100-share buy order might execute against tiny pieces of that institutional 2-million share sell order.
You bought "at market." You have no idea you provided exit liquidity to a large institutional seller. You saw bullish price action on your chart. You don't realize you're buying from someone who's unloading a massive position quietly.
This isn't illegal. This isn't manipulation. This is just how market structure works.
But it creates information asymmetry. Institutions know they're selling 2 million shares. You don't know you're buying from them.
THE HIGH-FREQUENCY TRADING FIRMS THAT EXPLOIT THIS
Now here's where it gets more sophisticated.
High-frequency trading firms have figured out how to detect large hidden orders in dark pools using a technique called "pinging."
They send tiny orders (1-10 shares) into dark pools to test for liquidity. If the ping order executes instantly, that signals the presence of a large hidden order.
The HFT firm then uses superior network infrastructure and co-located servers to race to public exchanges ahead of the institutional order. They buy if they detected institutional buying interest. They sell if they detected institutional selling interest.
Then they offer to complete the institutional order at a marginally worse price than the institution could have gotten originally.
This is called latency arbitrage. It extracts billions of dollars annually from institutional investors.
The counterparty to this isn't typically retail investors directly. But it affects everyone because it increases transaction costs and reduces the liquidity advantage that dark pools were supposed to provide.
The entire system is designed around speed measured in microseconds and information advantages measured in milliseconds.
THE ORACLE DARK POOL SIGNAL THAT PREDICTED THE CRASH
Let me show you a concrete example of how dark pool analysis provides advance warning.
In mid-November 2025, Oracle's dark pool volume spiked to 4.2 times its 30-day average. For three consecutive days.
Meanwhile, Oracle's stock price declined 1.8% during those three days. Public exchange volume was only 1.3x average.
Here's what this tells you:
High dark pool volume + declining price = institutional distribution (selling).
If dark pool volume was 4.2x average and price was rising, that would suggest institutional accumulation (buying).
But the combination of elevated dark pool volume + declining price + normal public volume = institutions selling heavily in dark pools while retail participants on public exchanges remained unaware.
Three weeks later, Oracle reported earnings, missed revenue expectations, and the stock crashed 11% overnight.
The dark pool signal was screaming "large players are exiting" three weeks before the crash.
This data is public. FINRA (Financial Industry Regulatory Authority) requires dark pools to report trades, usually with a 2-4 week delay. By the time you can analyse it, it's ancient history.
But Bloomberg Terminal users get dark pool indicators with much shorter lag. They can identify when dark pool volume spikes for specific stocks in near real-time.
QUANTIFYING WHETHER THE SIGNAL IS ACTUALLY UNUSUAL
When dark pool volume hits 4x average, is that unusual? Depends on the stock, the context, the typical volatility.
You need to quantify this statistically.
Pull historical dark pool volume for Oracle. Calculate mean and standard deviation over the past year. Compute the z-score for the November spike.
Z-score = (Observed Volume - Mean Volume) / Standard Deviation For Oracle's November spike:
- Observed volume: 42 million shares (3-day average)
- Historical mean: 10 million shares
- Standard deviation: 11 million shares Z-score = (42 - 10) / 11 = 2.91
That's 2.91 standard deviations above normal.
The probability of a volume spike this large occurring by random chance: using the standard normal distribution, a z-score of 2.91 corresponds to the 99.82nd percentile.
That means only 0.18% probability of occurring randomly. Less than 1 in 500 days. This isn't noise. This is a signal.
But calculating this requires:
- Historical dark pool data (subscription services: thousands per year)
- Statistical knowledge (z-scores, normal distributions)
- Programming tools (Python, R, or Excel)
- Time to set up monitoring systems
Bloomberg has this built-in. Query Oracle, go to "Dark Pool Monitor," the system calculates z-scores automatically and flags unusual activity.
Without it, you're completely blind to this information even though it's technically public data.
THE TESLA JULY 2023 CASE STUDY
Let me give you another example that demonstrates this framework perfectly.
July 2023. Tesla was trading around $220. AI Day event scheduled for late July where Elon Musk would unveil new Optimus robot prototypes and Full Self-Driving updates.
Two weeks before the event:
Dark pool buy volume spiked to 3.8x average for Tesla. Price rising modestly (+4% over those two weeks). Options flow showed massive call sweeps at $250 strike (14% out of the money).
One particularly large block: $2 million notional in $250 calls expiring in August 2023.
This is institutions positioning ahead of a known catalyst. They had publicly available information (AI Day schedule was announced). They calculated probable market reaction. They positioned accordingly using dark pools and options markets to minimize visibility.
AI Day happened. Musk unveiled impressive demos. Stock rocketed 45% over the next three weeks to $280.
Those $250 calls that cost roughly $6-7 per contract went to $30+ per contract when stock hit
$280. That's 430% return.
The $2 million position became approximately $8.6 million.
The data was public. Dark pool volume is reported. Options trades are reported. The AI Day schedule was public.
But you need infrastructure to monitor thousands of stocks for unusual dark pool and options activity, statistical tools to identify what's unusual vs normal noise, and experience to interpret the signals correctly.
Bloomberg's "Unusual Activity" screen does this automatically. It scans dark pool volume, options flow, and trading patterns across all securities and flags statistical anomalies.
Retail investors have Reddit posts saying "someone knows something" posted after the stock already moved.
THE NIKE DECEMBER 2023 EXAMPLE
One more example: Nike in December 2023.
Nike trading around $120 ahead of Q2 earnings. No obvious catalyst for major move.
Dark pool sell volume spiked to 4.1x average. Put volume for $110 strike (8% out of the money) surged to 15x existing open interest in one day.
One block trade: $3 million in $110 puts expiring three weeks out.
That's a massive directional bet that Nike drops 8%+ in three weeks. Or it's sophisticated hedging by someone with information about upcoming earnings weakness.
Two weeks later, Nike reported. Revenue guidance slashed. China sales deteriorating. Stock dropped 12% overnight.
Those $110 puts that cost approximately $2.50 went to $12 per contract. That's 380% return overnight.
The $3 million position became roughly $11.4 million.
Again, the data was public. Dark pool reports showed elevated selling. Options exchanges published the unusual put volume.
But detecting this requires:
- Real-time monitoring of dark pool activity across thousands of stocks
- Statistical models to identify z-scores > 2.5 as unusual
- Options flow analysis to identify unusual volume relative to open interest
- Correlation analysis to combine both signals
This is infrastructure. Not genius. Not inside information. Just tools that process public data into actionable signals.
THE REGULATORY FRAMEWORK THAT ALLOWS THIS
You might be wondering: if dark pools create information asymmetry, why are they legal?
The SEC authorized dark pools through Regulation NMS (National Market System) in 2007. The intention was to allow large institutional orders to execute without market impact.
Before dark pools, large institutions would break orders into smaller pieces and work them gradually over days or weeks. This was inefficient and expensive.
Dark pools were meant to improve market efficiency by allowing large blocks to trade without disrupting prices.
The unintended consequence: now more than half of all trading volume is invisible, creating massive information asymmetry between participants who can analyze dark pool data and participants who can't.
Dark pools must report trades to FINRA after execution. But "after execution" means the information is backward-looking. By the time you see the trade, it's done.
The regulatory framework requires transparency but delays it enough that the information is useless for real-time decision-making.
Institutions with Bloomberg Terminals get near-real-time dark pool indicators. Retail investors get delayed reports weeks later.
That's the gap. Legal. Documented. Structural.
THE TOOLS YOU NEED THAT YOU DON'T HAVE
Let me be very specific about what dark pool analysis requires:
Data Sources:
- FINRA TRF (Trade Reporting Facility) data: free but clunky, delayed 2-4 weeks
- Professional data vendors (Bloomberg, Refinitiv): $20,000-30,000 per year
- Alternative data providers (Quandl, IEX Cloud): $5,000-10,000 per year
Statistical Tools:
- Z-score calculations to identify unusual volume
- Time series analysis to establish baselines
- Correlation analysis between dark pool volume and price movements
- Pattern recognition across thousands of securities
Implementation:
- Programming skills (Python or R)
- Database infrastructure to store historical data
- Automated monitoring systems to flag unusual activity
- Visualization tools to display signals
Bloomberg Terminal consolidates all of this into one interface. Dark Pool Monitor shows you:
- Real-time dark pool volume by venue
- Z-scores relative to historical averages
- Correlation with price movements
- Statistical significance of unusual patterns Cost: $27,660 per year.
Without Bloomberg, you're building everything from scratch. That's 200-300 hours of development time if you have the skills. Plus ongoing data costs. Plus maintenance.
Or you trade without dark pool analysis at all and miss signals like Oracle's 4.2x volume spike three weeks before the crash.
THE FUNDAMENTAL ASYMMETRY
Let me state this clearly: markets are not rigged in the sense of illegal activity. Everything I've described is legal and documented.
But markets are structurally asymmetric.
Institutions trade in dark pools to hide their activity from other market participants. Then they analyze dark pool data to infer what other institutions are doing.
Retail investors trade on public exchanges where all their orders are visible. And they can't effectively analyze dark pool data because they lack the infrastructure.
Your 100-share buy order is visible to everyone. Their 2-million share sell order is hidden in dark pools until after it executes.
They can see your activity. You can't see theirs. That's not a conspiracy. That's market structure.
51% of trades happen in darkness. You're trading in the light. And you wonder why you always seem to be on the wrong side of major moves.
It's not bad luck. It's information asymmetry by design.
WHAT THIS MEANS FOR HOW YOU TRADE
So what do you do with this information?
You can't access dark pool data in real-time. You can't build monitoring systems without significant investment. You can't compete on equal footing with institutions.
But you can understand that:
- Large price moves often have advance signals in dark pool activity that you can't see
- When stocks crash "unexpectedly," institutions usually exited weeks earlier via dark pools
- Your trading decisions are made with incomplete information by structural design
- The playing field is not level, and acknowledging that is better than pretending it is
This doesn't mean you can't be a successful retail investor. Index funds exist. Long-term investing works. You don't need to trade actively to build wealth.
But if you're day-trading or swing-trading individual stocks, you're competing against participants who can see 51% of market activity that you can't.
That's the reality. Not opinion. Not speculation. Documented fact.
Until retail investors have access to the same analytical infrastructure that institutions have, this gap persists.
And institutional participants have zero incentive to close the gap because they profit from it.
The only way this changes is if someone builds institutional-grade analytics at retail-accessible prices. That's technically possible. The software isn't magic. The data exists.
But nobody's done it yet because building it is hard and the business model is unclear.
That's where I come in. I'm working on exactly this problem. No promises on whether it'll work. But at minimum, you now understand exactly what the problem is.
51% of trades happen where you can't see them. Institutions analyze that hidden activity. You don't have the tools.
That's the gap. That's what needs fixing. That's what I'm building toward.